
Why patent family continuity visualization is harder than it looks
If you've ever tried to map out the continuity relationships for a patent family with more than a handful of members, you know the pain. Patent family continuity visualization should be straightforward, the information exists, but it's fragmented across multiple sources, each with its own conventions and blind spots.
Patent attorneys need to understand how applications in a family relate to each other. This information drives prosecution strategy, priority date analysis, and portfolio-level decision-making.
Building patent family continuity visualization
We built &AI's patent family visualization tool to pull from multiple sources and reconcile them into a single graph. Each source has strengths and limitations worth understanding.

USPTO
The USPTO's Open Data Portal API is our primary source for US continuity relationships. It provides structured data about parent-child relationships between applications, including relationship types (continuation, divisional, CIP) and filing dates.
The limitation: coverage begins on January 1, 2001. For any application filed before that date, the ODP API has no data. Given that many active patent families trace lineage back to the late 1990s or earlier, this is a meaningful gap.
International patent office databases
For pre-2001 US applications and international filings, we pull continuity data from databases that aggregate patent information across multiple patent offices worldwide. These sources provide the most comprehensive coverage for cross-jurisdictional family data, filling the gap that the ODP API leaves for older and non-US applications.
Application Data Sheet (ADS)
The ADS is filed by the applicant and contains the applicant's own declaration of continuity relationships. We parse the ADS of the target application to extract this local continuity information.
This is where things get interesting. The ADS reflects what the applicant claimed about the application's relationships at the time of filing, but ADS filings can contain errors, like wrong parent application numbers, missing relationships, or incorrect filing dates.
Recursive graph building
The core of our approach is recursive graph construction. The user provides a single application number, and the system walks every continuity relationship it finds to build the complete family graph.
The process works like this: given an input application number, we query our data sources for all known continuity relationships involving that application. For each related application we discover, we repeat the query. This continues until we've exhausted all reachable relationships. The result is a complete continuity map with every application in the family and every relationship between them, fully linked and typed.
ADS discrepancy detection
The ADS parsing layer deserves special attention because it addresses a data accuracy problem.
When we parse the ADS and compare it against the continuity graph built from external sources, we track four types of discrepancies: relationship existence, relationship type, filing dates, and application numbers.
In one case we found, an ADS listed provisional 61/976,445 when the correct provisional was 61/976,554 — a simple error that broke the priority chain for an entire branch of the family. Every application downstream of that incorrect provisional was pointing to a filing that didn't establish the priority they thought it did.

We don't modify our continuity graph based on ADS data. Instead, we cross-reference the ADS against what we find in external sources, and we log any discrepancies. These discrepancies represent potential filing errors that attorneys should be aware of. We're building toward surfacing these as contextual alerts, flagging potential issues for the attorney to investigate, not making automated corrections.
Try it yourself.
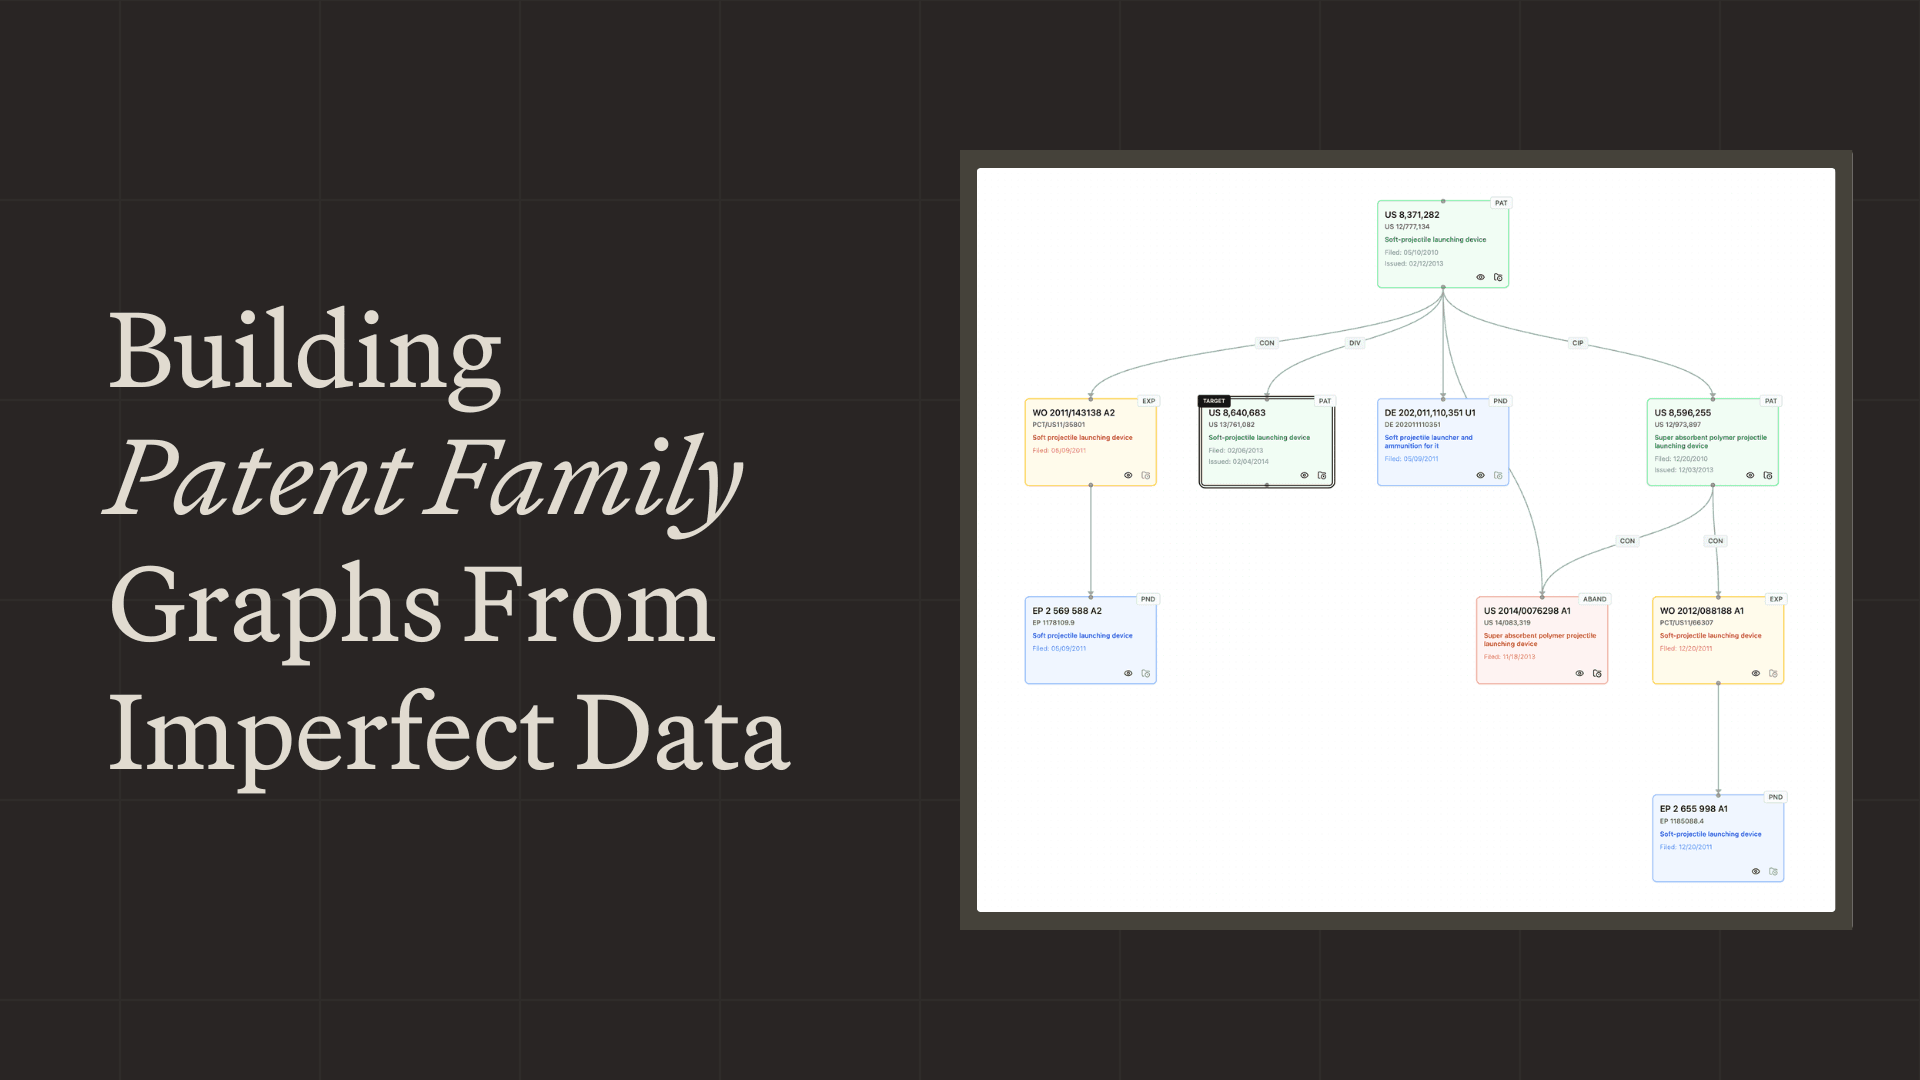
&AI's patent family tool is live in the platform. Enter any US application or patent number and get the full family graph — every continuation, divisional, CIP, and PCT national phase entry, pulled from USPTO and international databases, reconciled automatically. Click any node to see patent details, switch to table view for filtering and bulk operations, or use the claims analysis view to track how claims evolved across the family.
Frequently asked questions
What is patent family continuity visualization and why is it difficult?
Patent family continuity visualization maps how applications in a family relate to each other, driving prosecution strategy, priority date analysis, and portfolio-level decisions. It is harder than it looks because the information is fragmented across multiple sources, each with its own conventions and blind spots. &AI's tool pulls from multiple sources and reconciles them into a single graph.
What data sources does &AI use to build patent family graphs?
&AI's primary source for US continuity relationships is the USPTO's Open Data Portal (ODP) API, which provides structured parent-child data including relationship types like continuation, divisional, and CIP. For pre-2001 US applications and international filings, &AI pulls from international databases that aggregate patent data across patent offices worldwide, and it also parses the applicant's Application Data Sheet (ADS).
Why doesn't the USPTO ODP API cover older patents?
The USPTO ODP API's coverage begins on January 1, 2001, so it has no data for any application filed before that date. Because many active patent families trace their lineage back to the late 1990s or earlier, &AI fills this gap using international patent office databases for older and non-US applications.
How does &AI build a complete patent family graph from one application number?
&AI uses recursive graph construction: the user provides a single application number, and the system queries its data sources for all continuity relationships involving that application, then repeats the query for each related application it discovers. This continues until all reachable relationships are exhausted, producing a complete map with every application and every relationship fully linked and typed.
How does &AI detect errors in patent continuity data like the ADS?
&AI cross-references the applicant's ADS against the continuity graph built from external sources and logs discrepancies in four categories: relationship existence, relationship type, filing dates, and application numbers. It does not modify the graph based on ADS data; instead it flags potential filing errors for attorneys to investigate, such as one case where an ADS listed provisional 61/976,445 when the correct provisional was 61/976,554, which broke the priority chain for an entire branch.
How do I use &AI's patent family tool?
&AI's patent family tool is live in the platform. Enter any US application or patent number to get the full family graph, including every continuation, divisional, CIP, and PCT national phase entry, pulled from USPTO and international databases and reconciled automatically. You can click any node for patent details, switch to table view for filtering and bulk operations, or use the claims analysis view to track how claims evolved across the family.

Scale your
patent expertise
&AI is a platform for patent litigators to craft trial-ready work product—fast enough for pitches, strong enough for court.