Figure Annotation for Claim Charts: Sharper Infringement Analysis
July 2, 2026
 Caleb Harris
Most discussions of patent infringement analysis stop at detection: finding where an accused product reads on the claims. But anyone who has built an evidence-of-use chart by hand knows detection is only the start. The chart still has to make that read legible to someone else. A limitation maps to a region of a product figure, a teardown photo, or a frame from a demo video, and getting that onto the page so a reader sees it is what the deadline never leaves room for.
So the figure gets shortchanged. You end up with an arrow pointing at the whole image, or no annotation at all. The citation is sound, but the chart records it without explaining it, and the reader has to reconstruct the argument the chart was supposed to hand them.
Compounding this, the same chart travels to very different audiences, and each one wants something different from the figure.
A claim chart has at least two jobs
What the annotation needs to do depends on what the chart is for at that moment in the case.
The teaching version goes to a judge, a jury consultant, an expert, or a litigation funder. These are readers who flip through and look at pictures, so specific annotations pay for themselves: a box on the accused component, an arrow to the contact surface, a label tying the image back to the limitation language. You're teaching the read to someone who hasn't lived inside the patent for months.
The pleading-stage version is the opposite. It goes out with a complaint or early contentions, where a general arrow, or none, is often what you want. It gives notice while leaving room to refine the theory as the case develops. Most matters use both. You build the teaching chart first to prove the read to yourself, file the stripped-down version, then bring the teaching chart back at expert reports.
The teaching version is where careful annotation earns its keep, and it's also the version that gets cut, because detailed markup is the part of the job that doesn't scale by hand.
What we built
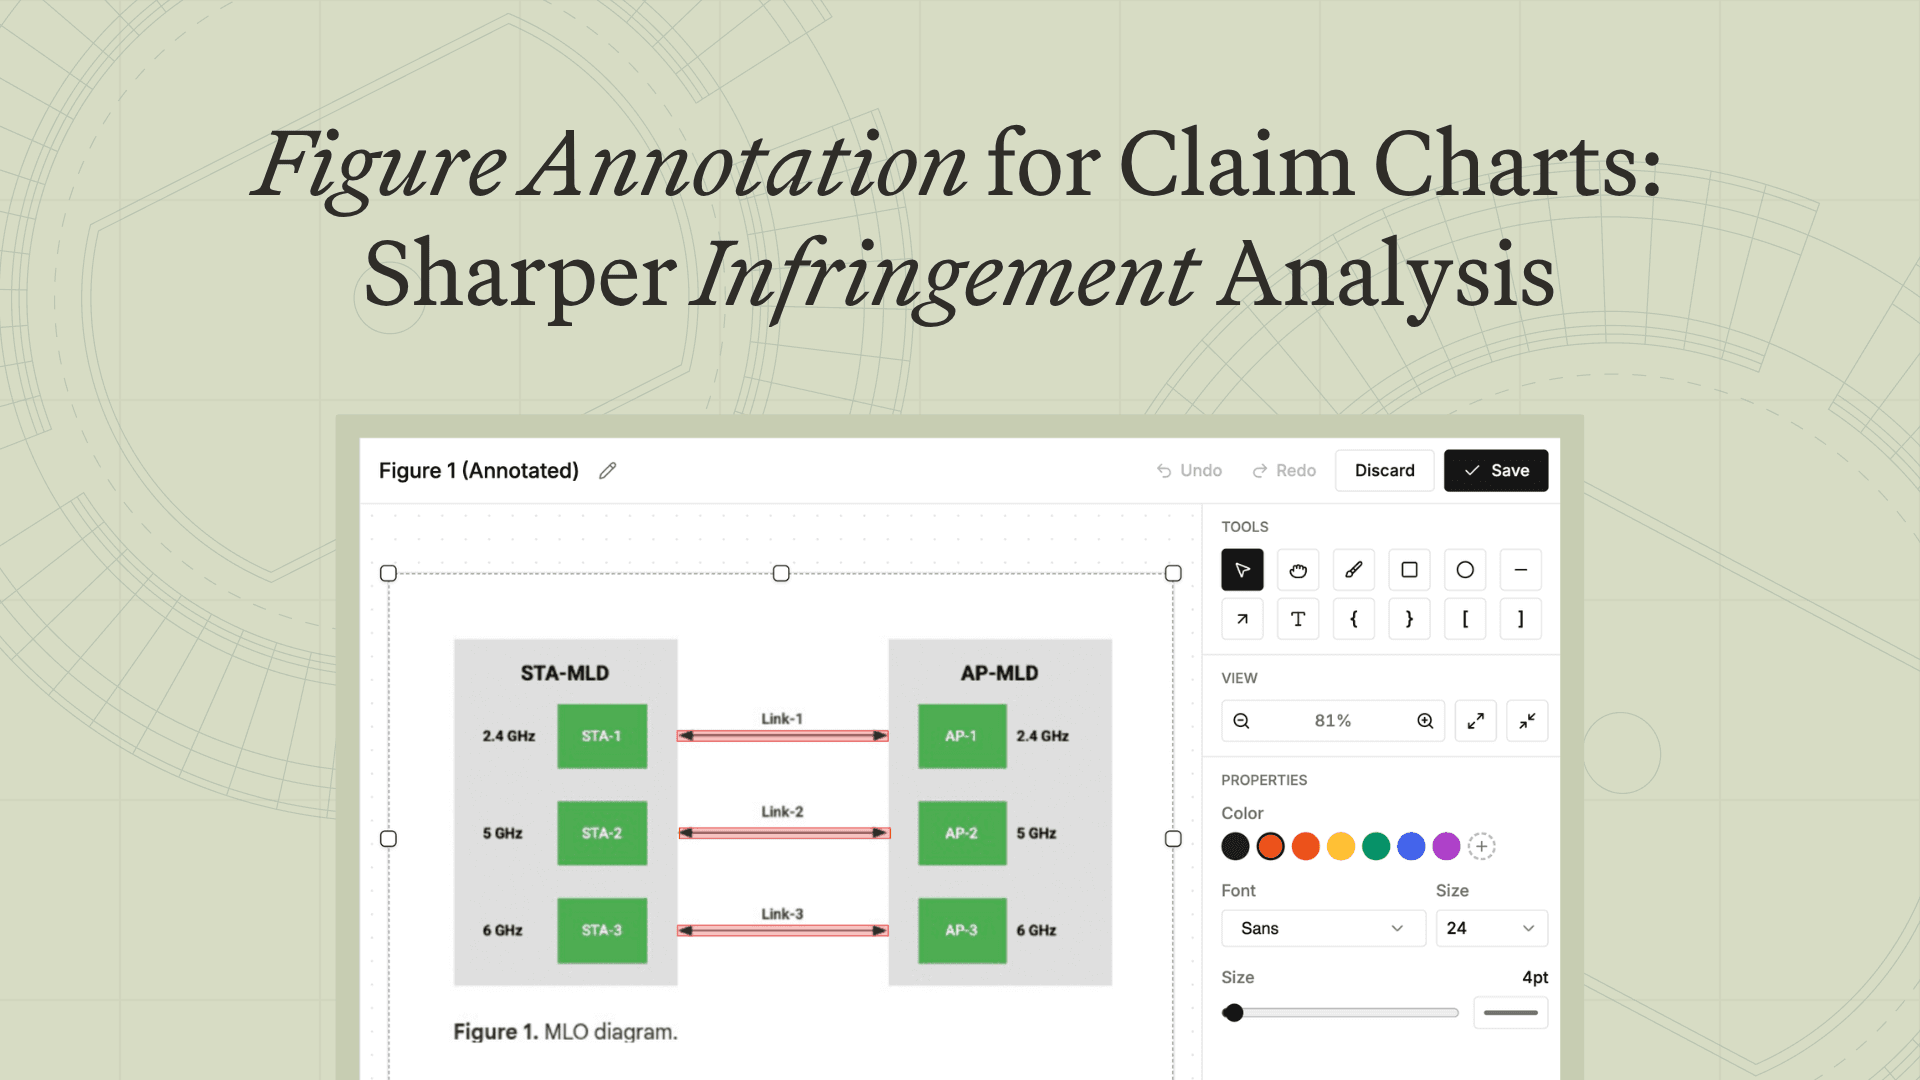
&AI's figure annotation closes that gap. When the charting engine maps a limitation to a figure, whether a patent drawing, a product spec image, a screenshot, or a video frame, it produces the annotation as part of the output rather than leaving it as a later chore.

The engine takes three inputs: the figure, the limitation, and the citation text. From those it generates annotation shapes, including boxes, arrows, highlights, and labels, in normalized coordinates so they render cleanly at any size. Crucially, the label text comes from the record itself, drawn from the figure's own text, the citation, and the surrounding context, not from the model's guess about what the picture shows. A well-annotated chart becomes the default output, not the thing you manage to produce when there's time left over.

Annotation density is also a setting. Export controls govern how heavily figures are labeled, how they're formatted and cited, and where they sit in the document. The teaching chart and the pleading chart come from the same evidence, with no re-annotation in between.
The impact
For litigators, the explanatory chart no longer competes with the deadline. The version you'd want in front of an expert or a jury is what the engine produces by default, and you can still dial it back for a filing. For funders weighing a portfolio, the figures explain themselves, so you can move across patents and accused products and actually see each theory rather than taking the citation on faith.
Annotation is what separates a chart that records a read from one that makes it. It gets skipped because it costs time, not because anyone doubts it's worth doing. Take that cost out, and you stop under-explaining the strongest part of your case.
&AI turns source-grounded figure annotation into trial-ready work product. Explore claim charts, prior art search, and infringement detection, see pricing, or book a demo to try it on your own matter.
Frequently asked questions
What is a claim chart?
A claim chart maps each element, or limitation, of a patent claim to specific evidence: prior art for an invalidity chart, or an accused product for infringement. Each row pairs the claim language with the citation that reads on it. &AI generates claim charts with pinpoint citations and source-grounded figure annotations.
What is an evidence-of-use chart?
An evidence-of-use (EoU) chart is the infringement version of a claim chart. It maps claim limitations to evidence that an accused product practices them, including spec sheets, manuals, teardown photos, screenshots, and video frames, turning infringement detection into a documented read. &AI builds EoU charts by retrieving and scoring that evidence against each limitation.
What is figure annotation in infringement analysis?
Figure annotation is the markup on a figure, including boxes, arrows, highlights, and labels, that shows where a claim limitation reads on a product image or patent drawing. It turns a citation into a visible argument rather than a reference the reader has to verify on their own.
How does &AI annotate patent figures?
&AI takes the figure, the claim limitation, and the citation text, then generates annotation shapes in normalized coordinates so they render cleanly at any size. Labels come from the source record, drawn from the figure's text, the citation, and the surrounding context, rather than invented, and every annotation is checked against the limitation and repaired if it falls short.
Can claim chart figures be annotated automatically?
Yes. &AI produces the annotation as part of the charting workflow rather than as a manual post-step, so a well-annotated teaching chart is the default output. Export controls let you set annotation density by case stage.
Why do claim charts get under-annotated?
Annotating well takes manual time, so under deadline the marginal figure gets an arrow at the whole image, or nothing. The read holds up; the explanation just never reaches the page. Automating it with &AI removes that trade-off.
What's the difference between a teaching chart and a pleading-stage chart?
A teaching chart uses detailed annotation to explain the read to a judge, jury, expert, or litigation funder. A pleading-stage chart keeps annotation general, giving notice while preserving flexibility as the case develops. Most matters use both, and &AI generates either from the same underlying evidence.
Related insights
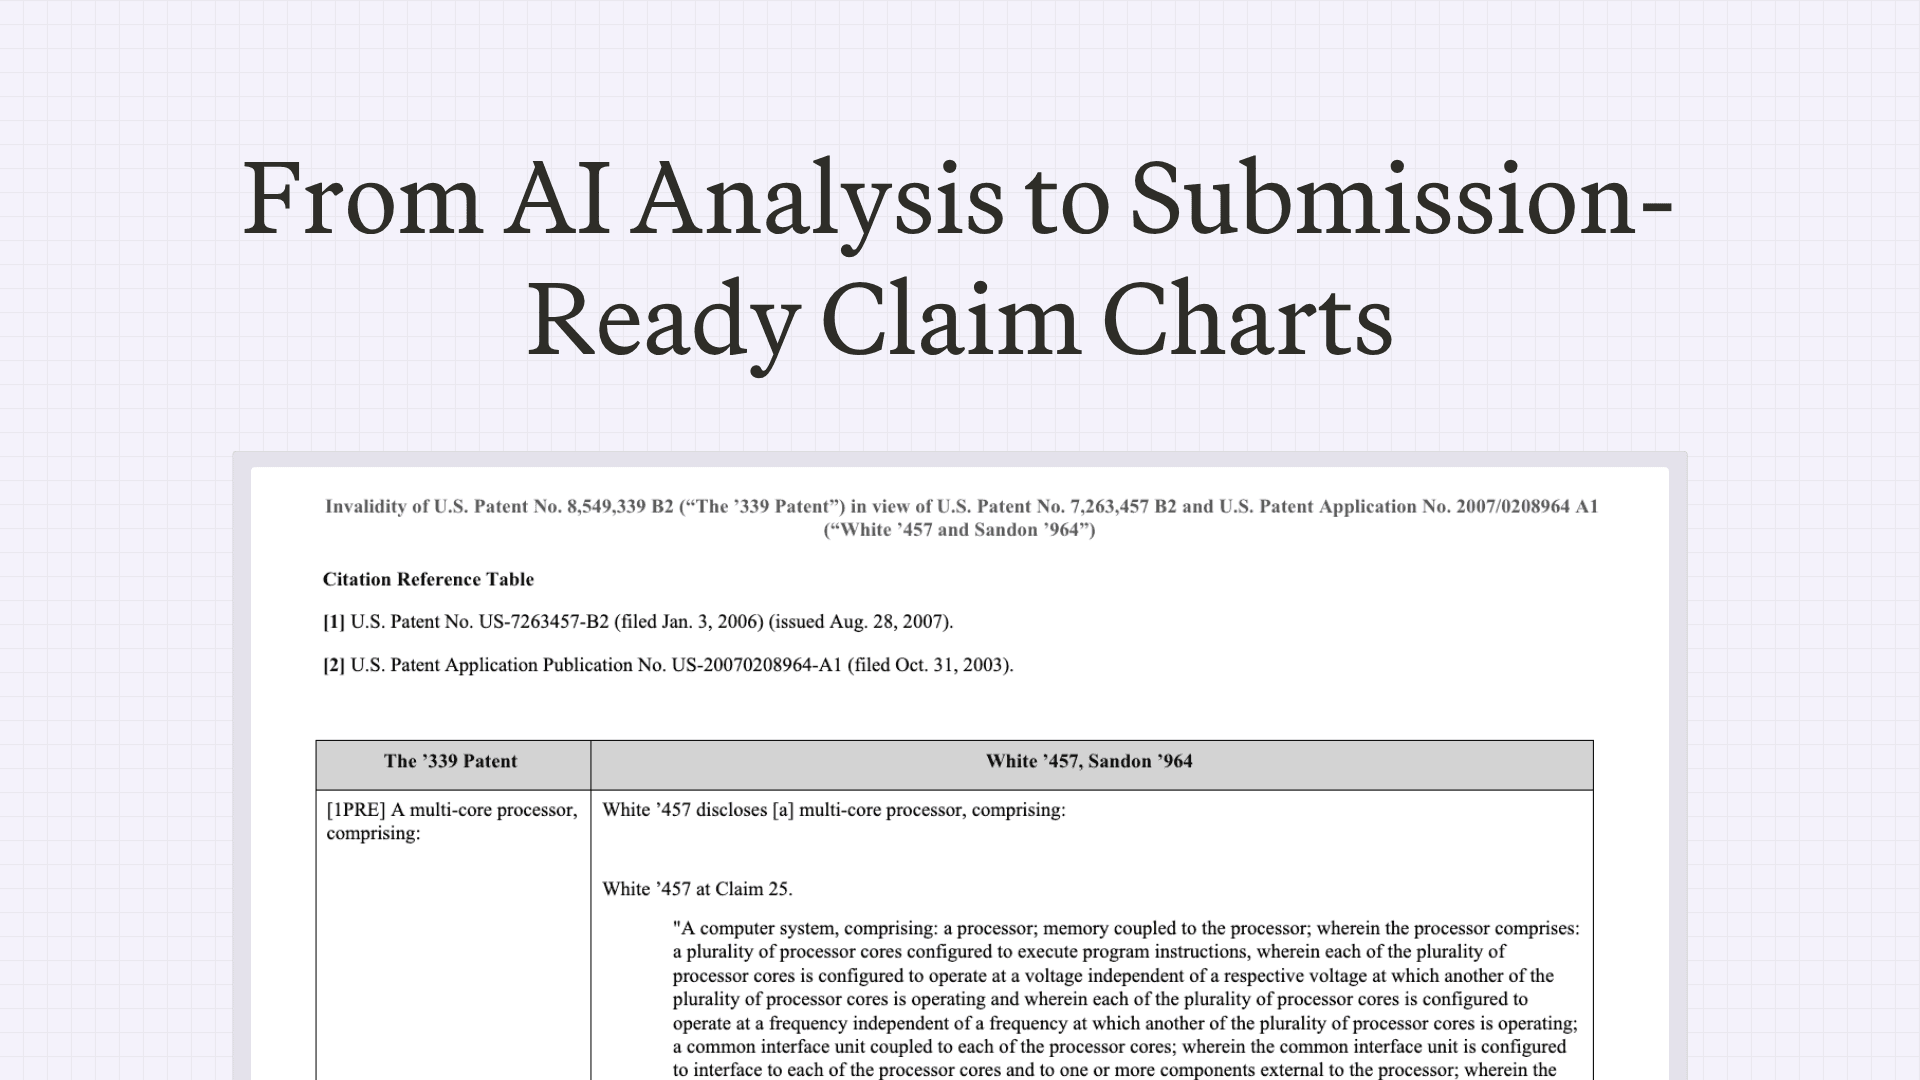
How Patent Litigators Draft Submission-Ready Claim Charts in &AI
&AI Chart Settings supports 65 formatting controls — limitation labels, Bluebook citations, screenshots, cell boilerplate, page layout, and more. The goal: from export to filing, with no edits in Word.
May 11, 2026
AI Patent Infringement Detection: Finding Evidence of Use at Scale
From a patent portfolio to a ranked list of likely infringing products and a defensible evidence-of-use chart.
June 30, 2026

Scale your
patent expertise
&AI is a platform for patent litigators to craft trial-ready work product—fast enough for pitches, strong enough for court.