
Claim charting follows a familiar routine: pull the patent, pull the prior art or product materials, open Word, build a table. Copy each limitation into the left column. Hunt for evidence. Paste. Format citations. Repeat.
After thousands of exported charts and countless conversations with users, &AI built Charts to shorten that loop without taking control away from you.
Request a free sample claim chart to evaluate our work product quality.
Create a strong first-draft chart in minutes
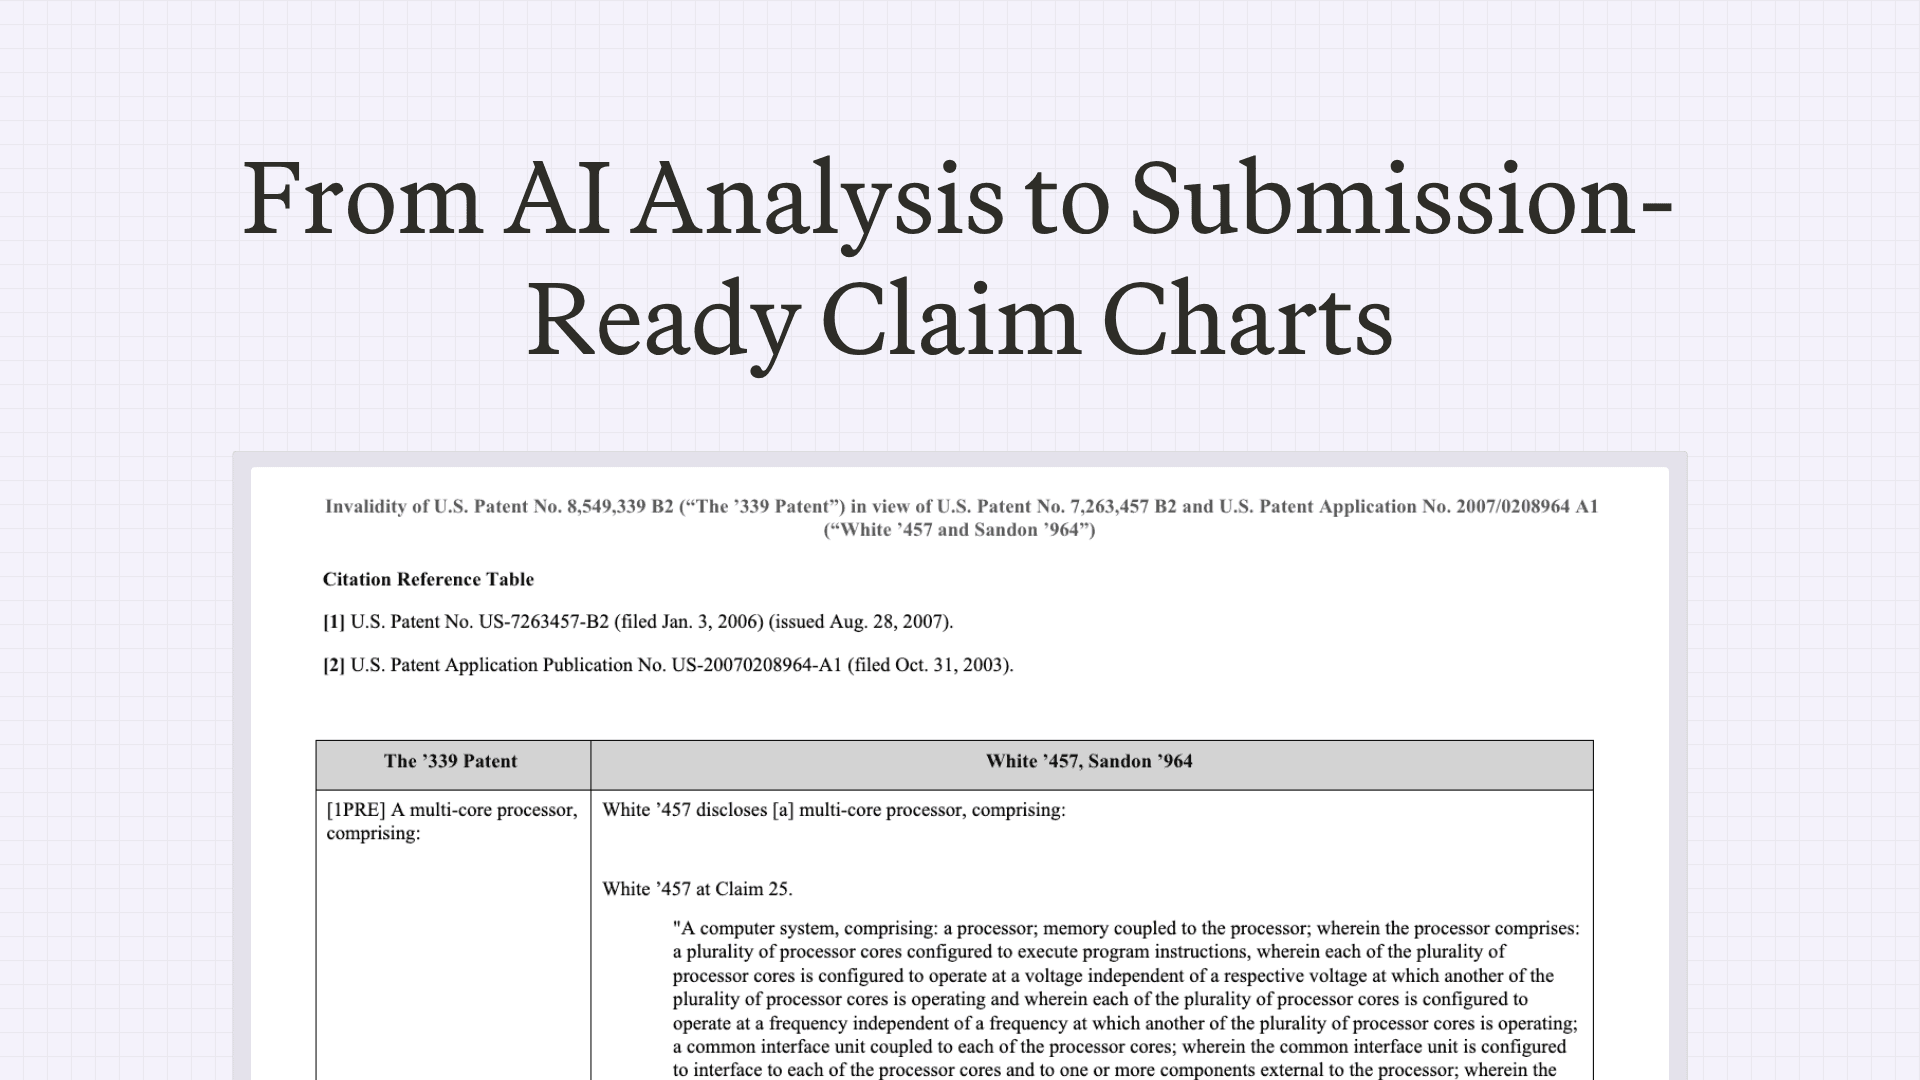
On the platform, you can generate a claim chart from a target patent and one or more materials, which may be patent documents, non-patent literature, specification sheets, or product teardowns (including video). For each claim element, &AI proposes supporting evidence from your materials with pinpoint citations and a short relevance rationale. If you need additional support, you can run keyword and semantic search across everything you’ve uploaded.
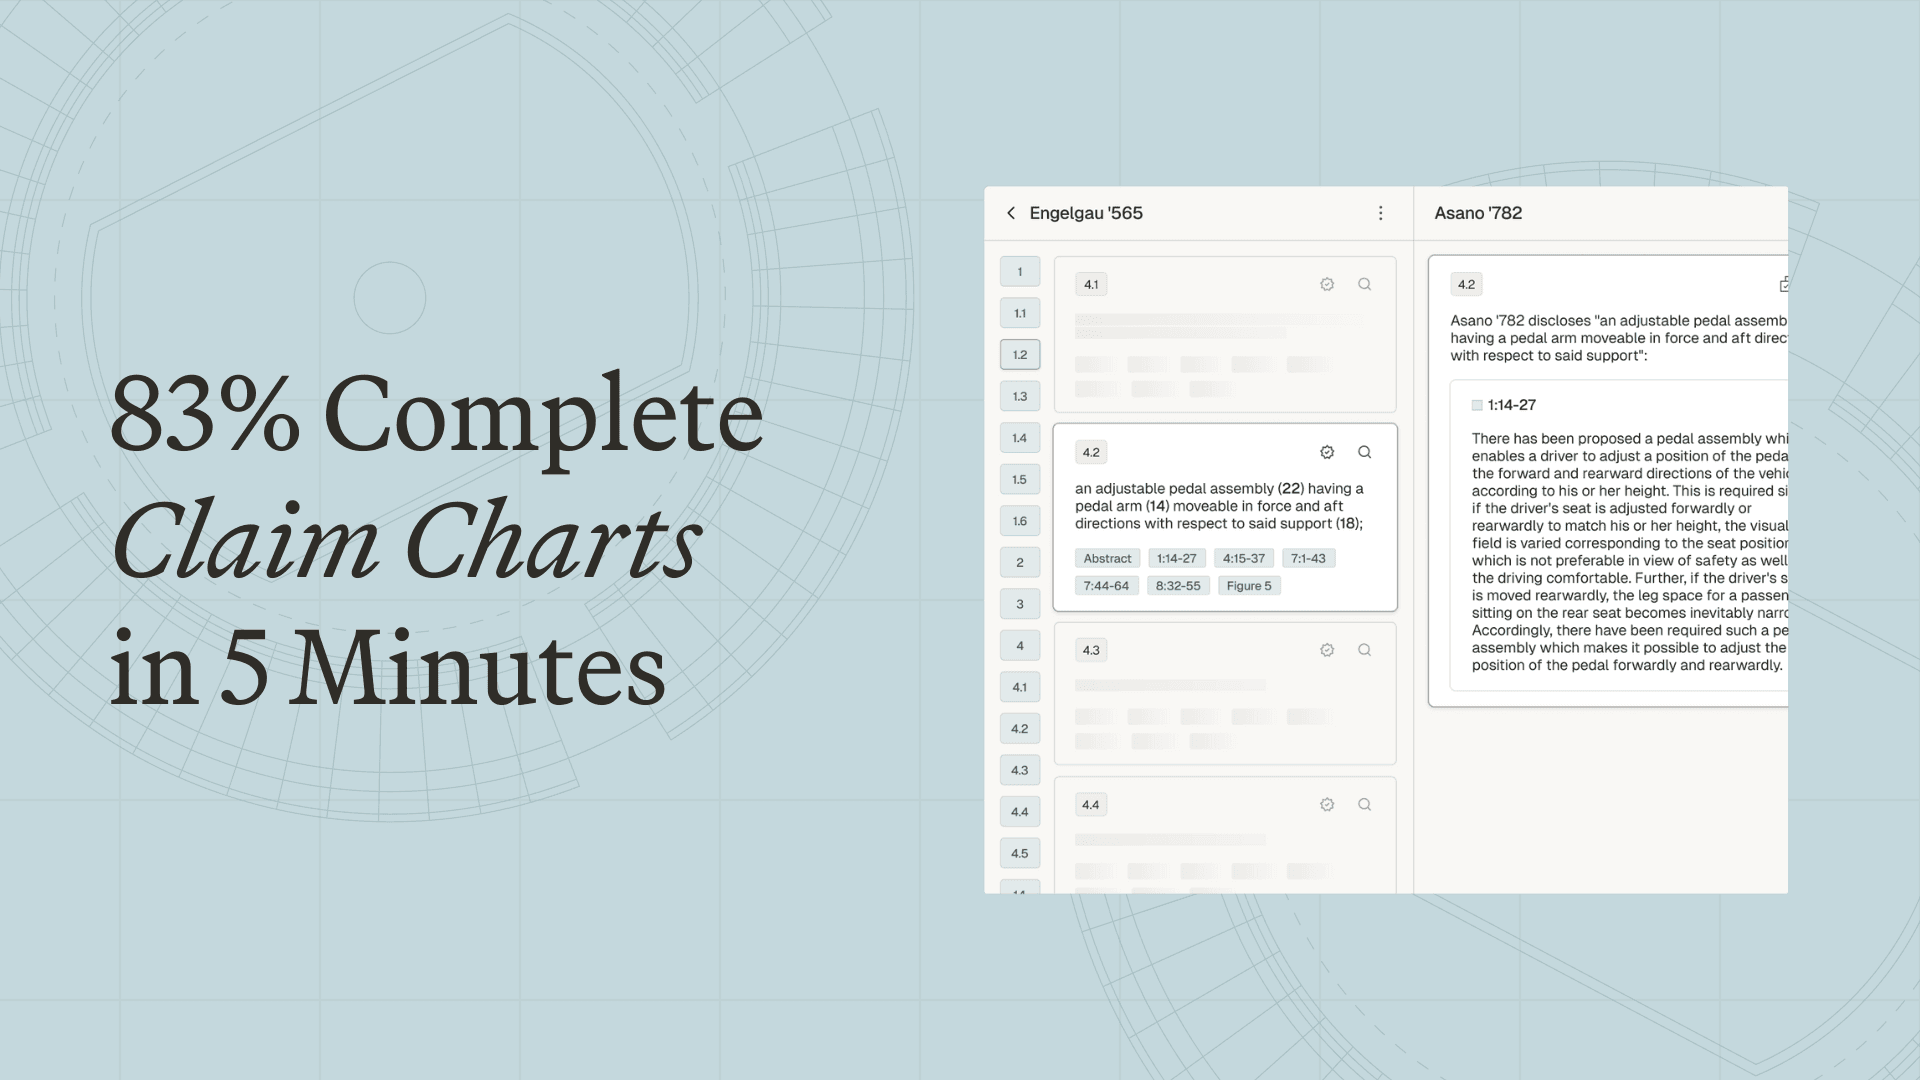
In an internal review of exported charts from the &AI platform, we found that approximately 83% of the evidence included in the final export was present in our first pass, for both invalidity and evidence-of-use charts.

Above all, you stay in control throughout: accept, reject, or refine each suggestion. Nothing is included in an export unless you approve it.
Compare references at a glance
The summary view illustrates how each document maps to each claim element, which is particularly useful for invalidity charts. Rather than charting one reference to completion, you can generate drafts for several and select the strongest reference before committing.
This way, gaps and overlaps surface sooner, so you can select the strongest reference (or the best combination) before you invest time polishing.

Maintain case context as positions evolve
Claim charts are living documents, so when constructions or strategy change, Charts can adapt in tandem. Add an Annotation with your updates, and create a new draft that reflects that direction, without starting from scratch.

Format your way
Finally, we know that both you and your firm have their own way of doing things. Charts supports dozens of export settings for boilerplate, citation formats, fonts, figure alignment, claim‑element labeling, and more. Set firm-wide defaults with per-user overrides to reduce post-export formatting.
If a setting you need is missing, we’ll build it.

Even more charting improvements are on the way. Firms and attorneys interested in a demo, or in shaping what comes next, can start a free trial or request a sample claim chart.
Frequently asked questions
How fast can &AI generate a claim chart?
&AI's Charts feature can create a strong first-draft claim chart in minutes from a target patent and one or more materials. In an internal review of exported charts from the &AI platform, approximately 83% of the evidence included in the final export was present in the first pass, for both invalidity and evidence-of-use charts.
What materials can &AI use to build invalidity and evidence-of-use claim charts?
&AI can generate a claim chart from a target patent and one or more materials, including patent documents, non-patent literature, specification sheets, and product teardowns, including video. For each claim element, &AI proposes supporting evidence from your materials with pinpoint citations and a short relevance rationale, and you can run keyword and semantic search across everything you've uploaded if you need more support.
Does the attorney stay in control of the AI-generated claim chart?
Yes, you stay in control throughout the process. For each suggested piece of evidence you can accept, reject, or refine it, and nothing is included in an export unless you approve it.
How does &AI help compare prior art references for invalidity charts?
The summary view shows how each document maps to each claim element, which is particularly useful for invalidity charts. Rather than charting one reference to completion, you can generate drafts for several references and select the strongest one, so gaps and overlaps surface sooner and you can choose the strongest reference or best combination before investing time polishing.
Can claim charts be updated when claim construction or strategy changes?
Yes, because claim charts are living documents, Charts can adapt when constructions or strategy change. You can add an Annotation with your updates and create a new draft that reflects that direction without starting from scratch.
Can &AI match a firm's claim chart formatting requirements?
Yes, Charts supports dozens of export settings for boilerplate, citation formats, fonts, figure alignment, claim-element labeling, and more. You can set firm-wide defaults with per-user overrides to reduce post-export formatting, and if a setting you need is missing, &AI says it will build it.
Related insights

Scale your
patent expertise
&AI is a platform for patent litigators to craft trial-ready work product—fast enough for pitches, strong enough for court.