Key takeaways
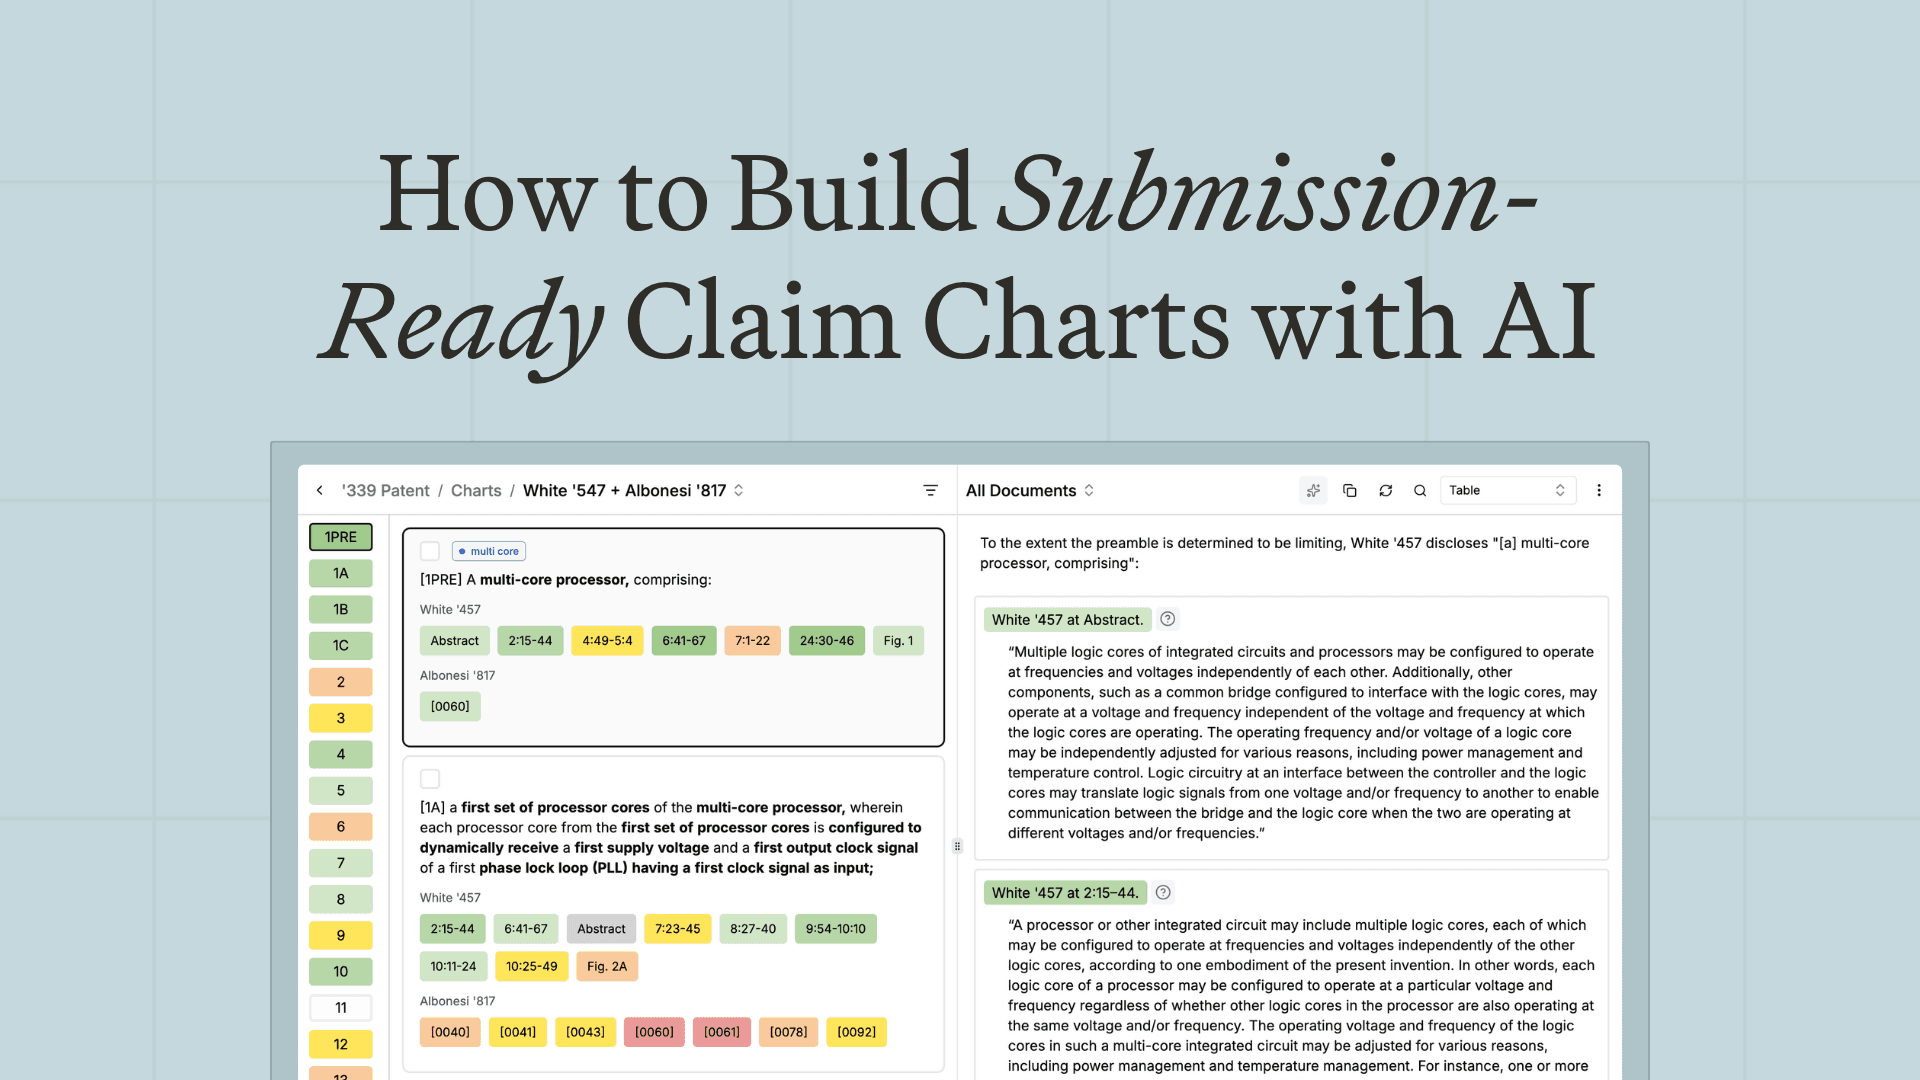
- A claim chart maps each limitation of a patent claim to the evidence that it is met, whether that evidence is prior art (for invalidity) or an accused product (for infringement).
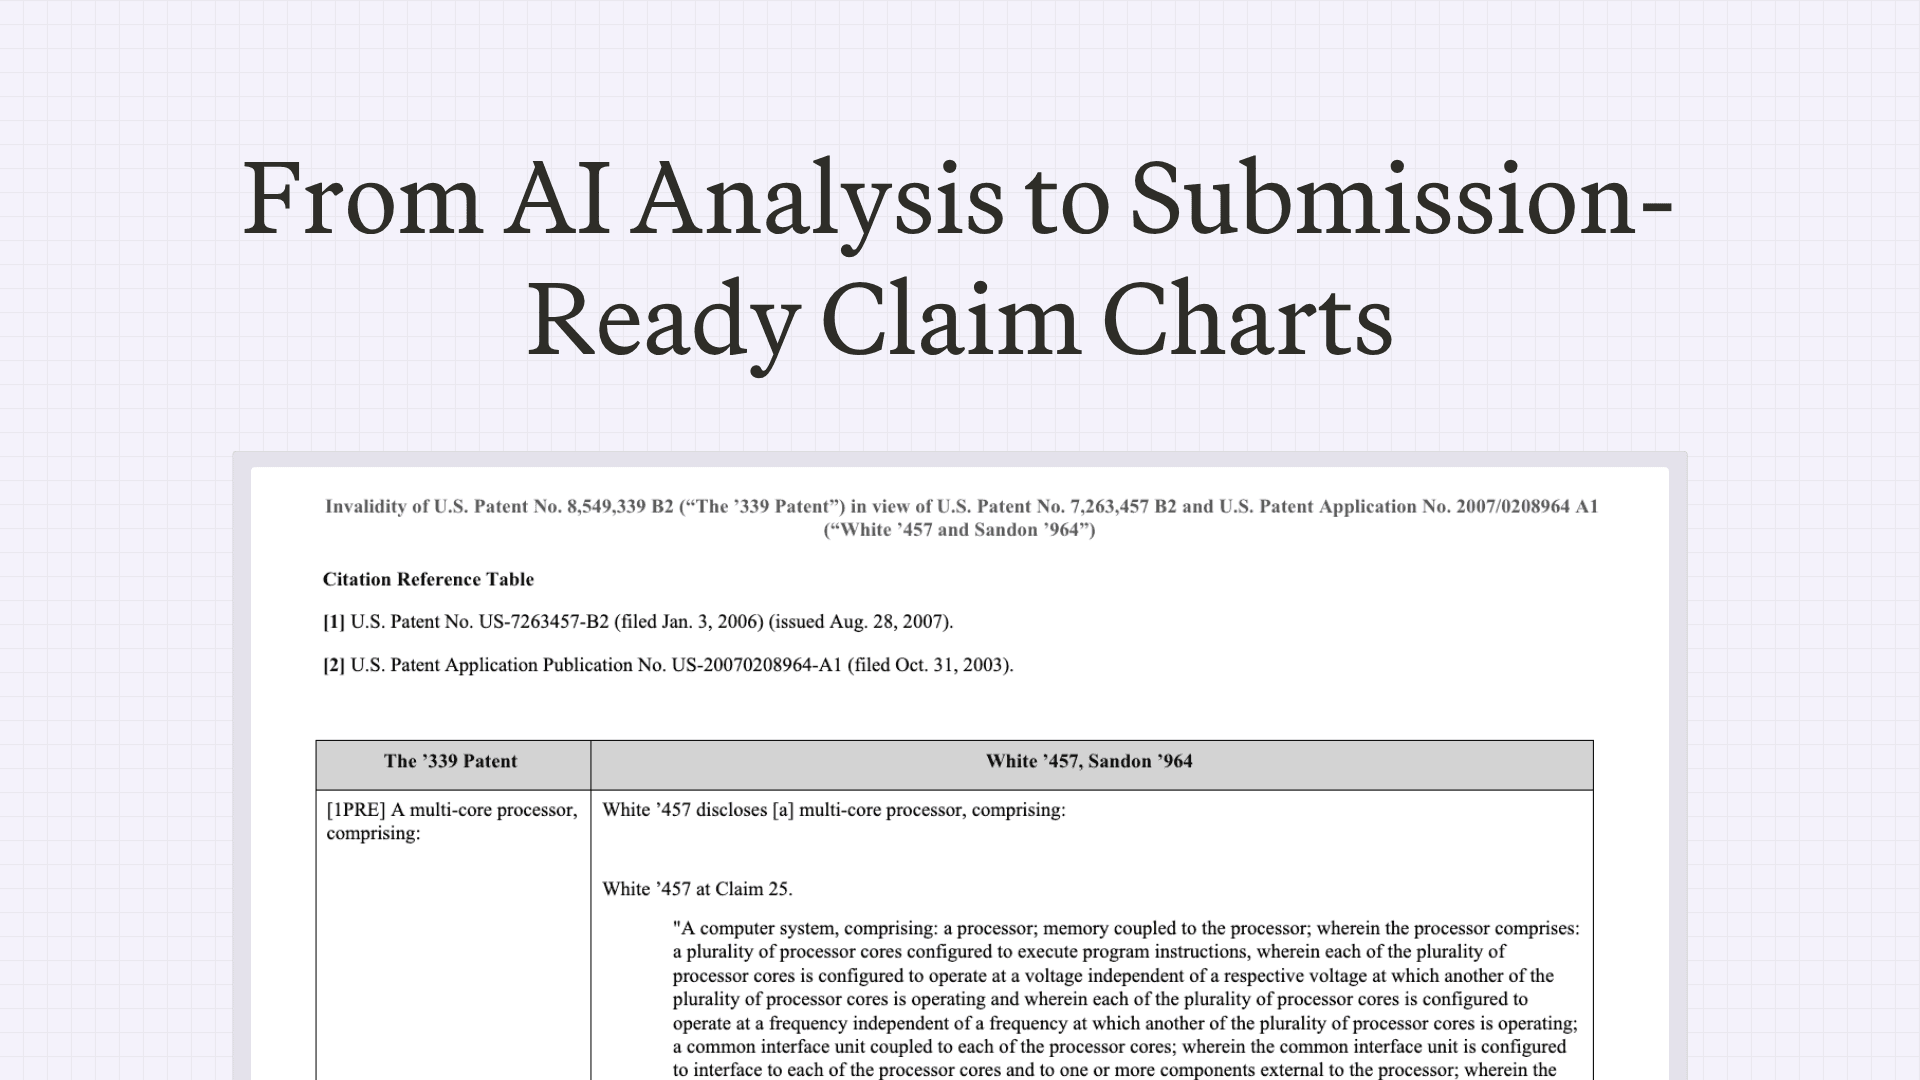
- "Submission-ready" is a high bar. It means correct limitation labels, proper citations, supporting screenshots, and formatting that holds up in the filing, not a rough draft you then rebuild in Word.
- AI can take a chart most of the way in minutes, but the value depends on how much formatting control it gives you and whether the output survives export without manual cleanup.
- &AI generates submission-ready charts with extensive formatting control and proper citations, so the path runs from analysis to a filed document without a detour through Word.
What makes a claim chart "submission-ready"?
A claim chart is the document that proves your case element by element. For invalidity, it maps each claim limitation to where a prior art reference discloses it. For infringement, it maps each limitation to where an accused product practices it. The structure is the same; the evidence differs.
"Submission-ready" means the chart is ready to go out as is, to opposing counsel, an expert, or the court. In practice that takes several things working together: every limitation labeled correctly and consistently, citations in the right format (Bluebook where called for), supporting screenshots or excerpts placed with the limitations they support, and page layout that survives the move into a filing. The gap between a rough chart and a submission-ready one is usually hours of formatting, and that is the part AI should remove.
How do you make a patent claim chart with AI?
The process follows the same logic a litigator uses by hand, with AI carrying the assembly.
- Start from the claims. Choose the asserted claims and break each into its limitations. Each limitation becomes a row in the chart.
- Bring in the evidence. For invalidity, that's the prior art references; for infringement, the accused product and its documentation.
- Map evidence to limitations. Align each limitation with the specific passage, figure, or product feature that meets it. This mapping is the heart of the chart.
- Add citations and exhibits. Attach properly formatted citations and any supporting screenshots or excerpts to the right rows.
- Format for filing. Apply limitation labels, layout, and any required boilerplate so the chart is ready to submit.
- Review and finalize. A human checks the mapping and the legal substance before anything goes out.
Done manually, steps three through five eat most of the time. AI can assemble a substantial draft of the chart quickly, leaving you to review the analysis rather than build the document.
Can AI create submission-ready claim charts?
Yes, provided the tool gives you real control over the output. A chart that's 80 percent right but needs an hour of reformatting in Word isn't truly submission-ready. The tools that clear the bar let you control limitation labels, citation format, screenshots, cell content, and page layout, so what you export is what you file.
This is where &AI focuses. It supports a deep set of chart formatting controls, generates proper citations, and places supporting screenshots with the limitations they support, with the goal of getting you from export to filing without edits in Word. On internal benchmarks, &AI produces a substantial share of a complete chart in minutes rather than hours.
What should you look for in an AI claim chart tool?
Charts are where small formatting failures create real rework, so judge tools on control and fidelity.
- Formatting control. Limitation labels, citation style, layout, and boilerplate should all be adjustable, not fixed to one template.
- Citation handling. Proper, consistent citations (including Bluebook where needed) should be generated, not retyped.
- Evidence placement. Screenshots and excerpts should sit with the limitations they support, automatically.
- Export fidelity. What you export should match what you saw, so you aren't rebuilding the chart in Word.
- Connection to the analysis. The strongest setups generate the chart from the same system that did the prior art or infringement work, so the evidence chain stays intact.
How do you avoid reworking claim charts in Word?
The rework usually comes from one place: a tool that produces content but not format, so every chart lands in Word for cleanup. You avoid it by choosing a tool whose output is built for filing from the start, where labels, citations, exhibits, and layout come out correct and export cleanly. The test is simple. Generate a chart, export it, and see how much you have to touch before it could go out. The less, the better.
Frequently asked questions
What is the best AI claim chart tool?
The best AI claim chart tool produces submission-ready output: correct limitation labels, proper citations, placed screenshots, and filing-ready layout that exports without reformatting in Word. &AI is built for that, with deep formatting control and citation handling, and it connects charting to the underlying prior art and infringement analysis.
How do I make a patent claim chart?
Break the asserted claim into limitations, gather the evidence (prior art for invalidity, the accused product for infringement), map each limitation to the passage or feature that meets it, add properly formatted citations and supporting exhibits, then format for filing and review the substance. AI can assemble most of the chart so you review rather than build it.
Can AI create submission-ready claim charts?
Yes, if the tool gives you control over labels, citations, screenshots, and layout and exports cleanly. Without that control you get a draft that still needs reworking in Word. Tools like &AI focus on producing charts you can file as is.
How can I generate litigation-ready claim charts faster?
Use a tool that assembles the chart from your claims and evidence and handles formatting and citations automatically, then spend your time reviewing the mapping rather than building the document. The biggest time sink in charting is formatting, so removing that is where the speed comes from.
Related insights
How Patent Litigators Draft Submission-Ready Claim Charts in &AI
&AI Chart Settings supports 65 formatting controls — limitation labels, Bluebook citations, screenshots, cell boilerplate, page layout, and more. The goal: from export to filing, with no edits in Word.
May 11, 2026
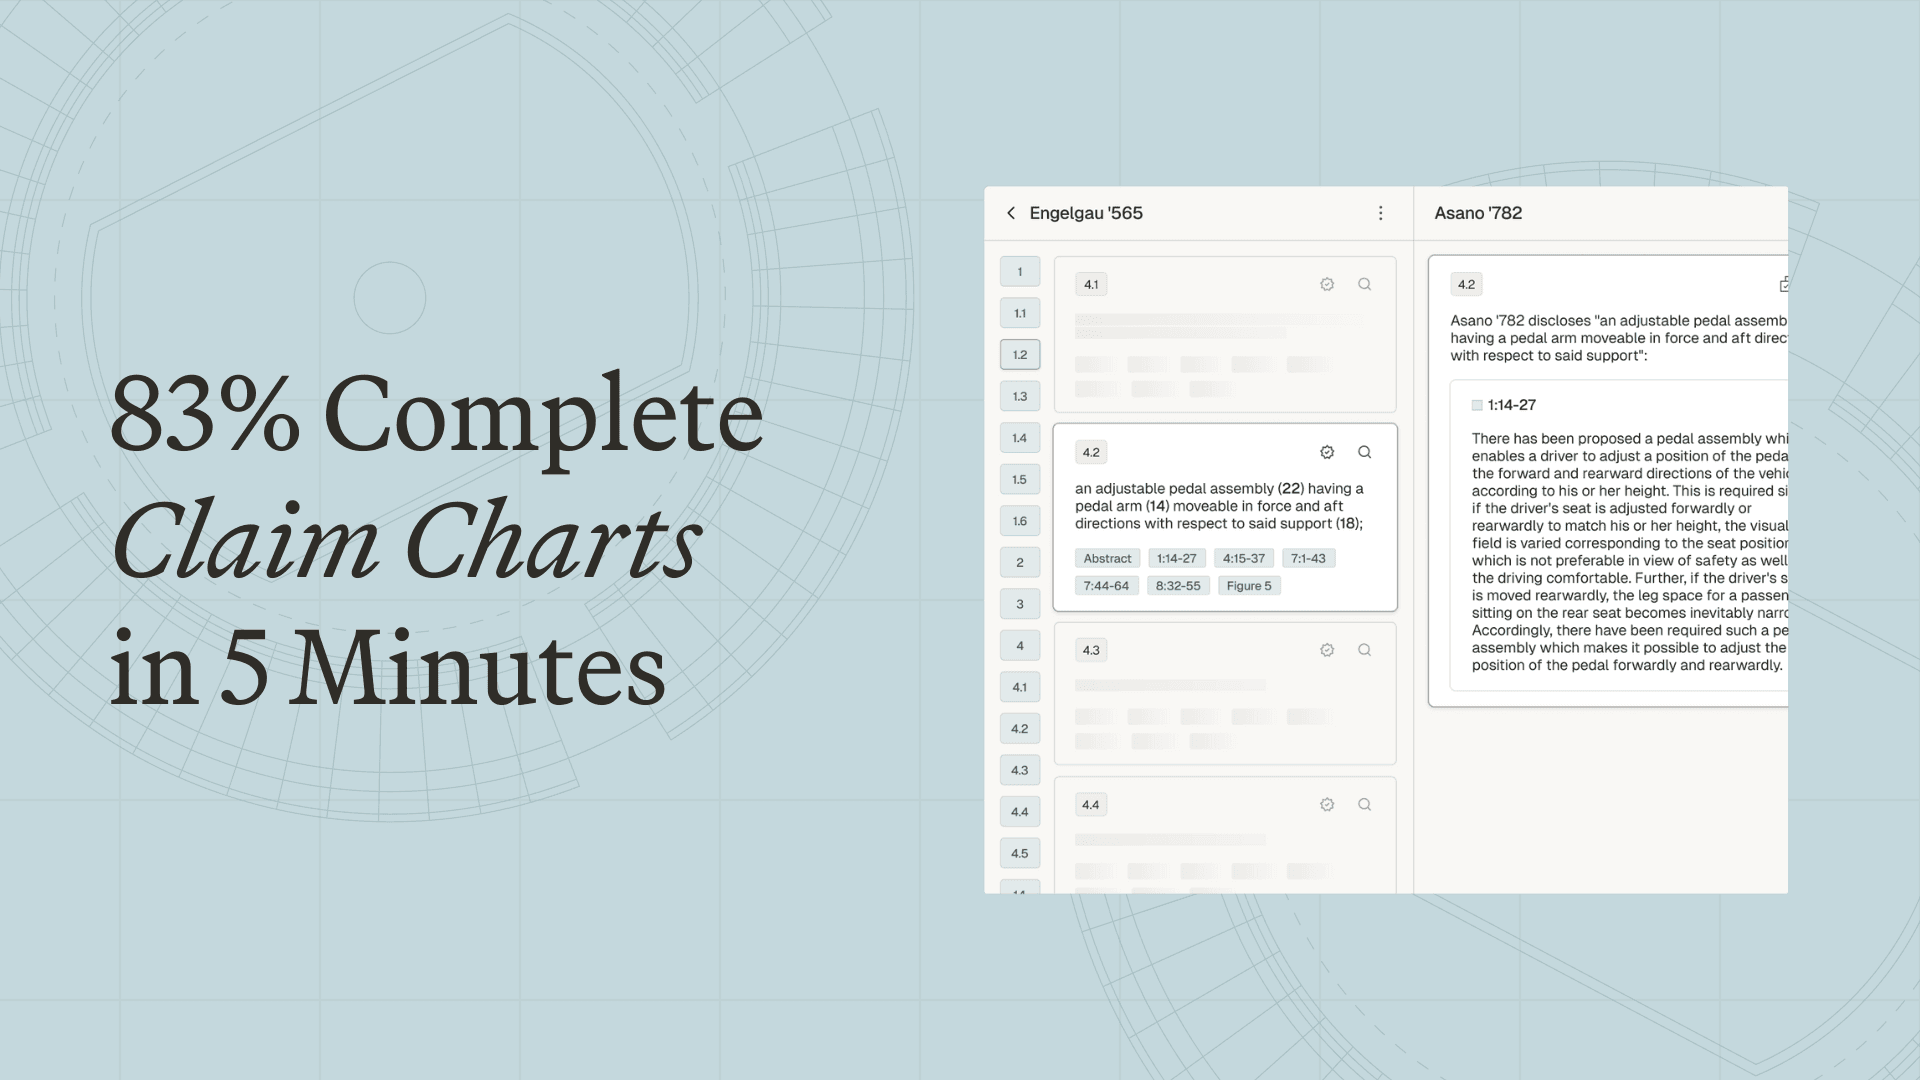
83% Complete Claim Charts in 5 Minutes
Deep technical analysis shouldn't be buried under hours of document assembly and formatting.
January 27, 2026

Scale your
patent expertise
&AI is a platform for patent litigators to craft trial-ready work product—fast enough for pitches, strong enough for court.